
Introduction
Raspberry Pi power monitoring is more than a tech flex—it’s a way to keep your projects from faceplanting mid-boot. If you’ve ever seen the little lightning bolt in the corner of your Pi’s screen, that’s your warning sign: power problems ahead. Now, you might think your fancy USB power brick is doing its job, but if you’re not measuring voltage and current directly, you’re just guessing.
Most hobbyists don’t realize how much variance there is in actual power draw. USB meters make this visible. Combine that with real-time logs, and suddenly you’ve got insights—not just blinking lights. Whether you’re troubleshooting reboots or checking if your USB SSD is sucking more juice than it should, there’s a good reason to plug in a meter and hit record.
Key Takeaways
- Use inline USB meters for quick checks and setup validation
- Use sensor modules for data logging and alerts
- Logging helps troubleshoot undervoltage, spikes, and failing supplies
- Tools like Node-RED, Grafana, and Python scripts bring real-time insights
- Optimizing power usage reduces crashes and prolongs SD card life
What Is Raspberry Pi Power Monitoring?
Understanding the Basics
Raspberry Pi power monitoring means measuring how much voltage and current your Pi pulls while running. It helps verify if your power supply is doing its job, or if you’re about to run into issues like sudden reboots, corrupted SD cards, or that annoying undervoltage icon. You measure in volts (V) and amps (A), then multiply them for power in watts (W). Some meters even track cumulative energy in watt-hours (Wh).
What You’re Actually Measuring
You’re typically watching three things:
- Voltage: Should stay near 5.1V for most Pis. Drop below 4.75V and you’re in trouble.
- Current: Tells you how hard your Pi is working or what your USB peripherals are pulling.
- Power: Gives you total consumption—useful if you’re battery powered or just curious.
Inline vs Embedded Monitoring
Inline meters sit between your USB power source and the Pi, like a digital speedometer for electricity. They’re quick to set up and great for live checks. Embedded solutions use sensors like the INA219 wired into your Pi’s GPIO pins. They give you more control and better logging, but take more effort.
Why It Matters
Power issues aren’t rare. Cheap cables, sketchy USB chargers, or just overloading your Pi with USB devices can throw the system off. Monitoring tells you when things go sideways before your Pi crashes—or worse, silently corrupts files over time.
USB Power Meters for Raspberry Pi
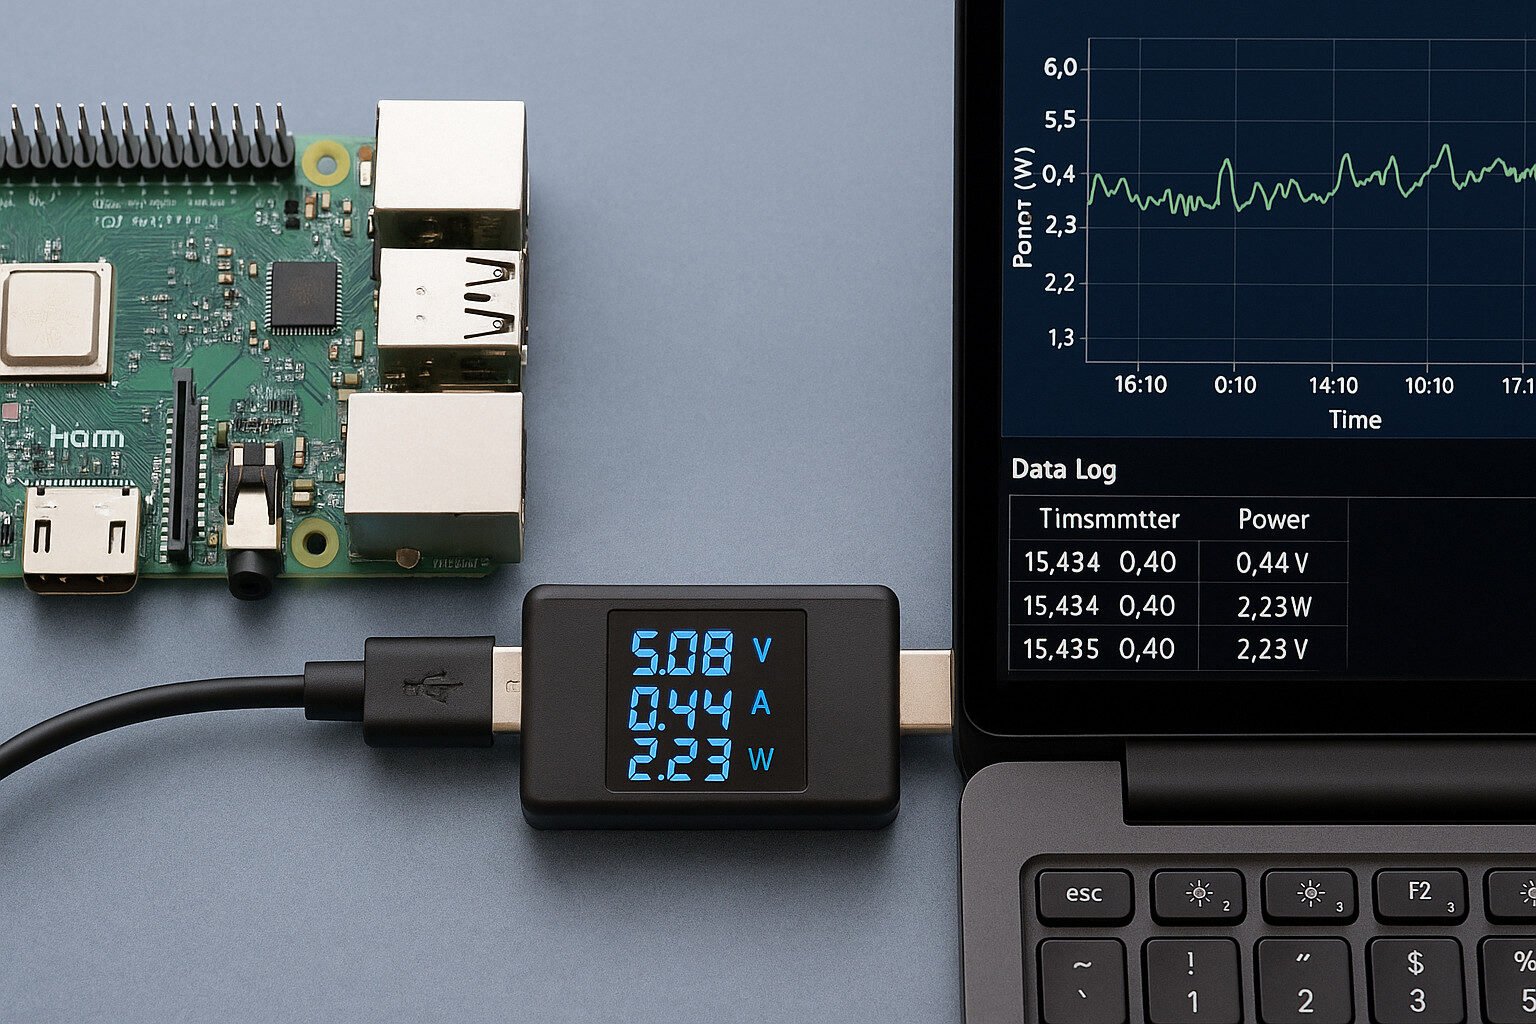
How Inline USB Meters Work
Inline USB meters plug directly between your power supply and your Raspberry Pi’s USB power input. They measure the voltage and current going through the line and display the results on a small screen. Some models log data, while others only show real-time readings. For most hobbyists, that’s more than enough to know if their Pi’s being underfed.
Types of USB Power Meters
Here’s what you’ll usually find:
- Basic display meters: Show voltage, current, and sometimes power. Examples include the JacobsParts and MakerHawk testers.
- Data-logging meters: These offer USB output or microSD storage, letting you pull logs for later analysis.
- USB-C specific meters: Useful if you’re powering a Pi 4 with a USB-C supply, like the Plugable USB-C Power Meter.
Popular Models Among Hobbyists
| Model | Interface | Max Current | Features |
|---|---|---|---|
| JacobsParts USB Meter | USB-A | 3.0 A | Basic, compact, low-cost |
| Plugable USB-C Meter | USB-C | 6.5 A | OLED display, high-res |
| FNIRSI FNAC-28 | USB-A | 3.0 A | Color LCD, multiple modes |
| SparkFun USB Power Meter | USB-A | 3.0 A | TFT display, graphing UI |
| Adafruit USB Meter | USB-A | 3.0 A | No frills, very reliable |
What to Watch For
Accuracy varies. Most budget meters are fine for casual use, but not lab-grade. Also, some meters insert resistance into the line, dropping voltage slightly—ironically, the tool used to diagnose undervoltage might cause it if poorly made.
When Inline Is Enough
If you’re just trying to see if your Pi’s power supply is cutting it or if your USB SSD is hogging too much juice, an inline meter gets you 90% of the way there. They’re fast, simple, and give you a visual readout without needing to open a terminal.

- Measure USB charging voltage, current, and discharge capacity over time
- Check the performance of USB cables, wall chargers, car chargers, and power banks
- Fast-charger compatible, works up to 20V and does not interfere with quick charge negotiation

- Digital LCD screen for clear and precise voltage, current, and load readings
- Automatically detects various fast charging protocols for added convenience
- Wide compatibility with USB Type C powered devices such as smartphones, tablets, and laptops


- Measure USB Type-C charging voltage, current, and discharge capacity over time
- Check the performance of USB cables, wall chargers, car chargers, laptop chargers, and power banks • Works in both direc…
- QC and PD compatible, works up to 30V and does not interfere with charge negotiation • Also shows data line voltage so y…
Sensor Modules for Embedded Monitoring
Going Beyond Inline
If you want more than real-time numbers on a screen—like logs, alerts, or remote dashboards—you’ll need to bring sensors into the mix. That means using components like the INA219 or INA260, which measure voltage and current over I2C and send the data straight to your Raspberry Pi.
Top Sensor Modules for Hobby Use
| Sensor | Interface | Voltage Range | Current Range | Notes |
|---|---|---|---|---|
| INA219 | I2C | 0–26 V | ±3.2 A | Affordable, great for 5V/USB |
| INA260 | I2C | 0–36 V | ±15 A | Built-in shunt, better accuracy |
| ACS712 | Analog | 5 V | ±5–30 A | Hall effect sensor |
| INA228 | I2C | 0–85 V | ±20 A | Advanced, high-precision |
Reading Data with Python
Most sensors like the INA219 have solid Python libraries. You can pull voltage and current values every second—or faster—then write those to a log file or database. Example values might look like:
bus_voltage = sensor.getBusVoltage_V()
current = sensor.getCurrent_mA()
power = bus_voltage * (current / 1000)
Accuracy and Calibration
These sensors aren’t perfect out of the box. Temperature, wiring, and even solder joints can affect readings. You may need to calibrate them using a known load and compare against a multimeter. Also, keep your I2C wires short—noise gets ugly fast.
When to Use Sensors Over Meters
Use sensors when:
- You need long-term logging
- You want to trigger alerts based on power draw
- You need to integrate readings into dashboards
- You’re doing automated analysis or headless monitoring
Inline meters are great for quick checks. Sensor setups are better when you’re building tools or monitoring systems that stay in place long-term.
Logging and Visualization Tools
Why Logging Matters
It’s one thing to see your Raspberry Pi’s voltage drop in real time—but if it happens at 3 AM, you won’t catch it unless it’s logged. Logging lets you find patterns, catch intermittent problems, and compare before-and-after tweaks. It’s the difference between guessing and knowing.
Simple Logging Options
For quick setups:
- Python scripts: Use
datetimeandcsvto write values from INA219 or similar sensors every second. - Shell scripts: For USB meters that output over serial, use
cat /dev/ttyUSB0 >> log.txtand a cron job. - CSV/JSON: Store logs in plain files that you can open in Excel, LibreOffice, or with Python.
Going Graphical: Node-RED and Grafana
For more visual folks:
- Node-RED: Drag-and-drop dashboard builder that can read sensor data, style graphs, and push alerts.
- InfluxDB + Grafana: Log data to a time-series database and build custom dashboards. Grafana’s visualizations are clear, colorful, and real-time.
Example Data Flow
- Python reads voltage/current every 5 seconds
- Writes to InfluxDB with time stamps
- Grafana reads InfluxDB and shows graphs
- Node-RED pushes alerts if current > 2.5 A
Live Monitoring Options
If you’re running headless (no display), publish the readings over:
- MQTT to your home automation broker
- WebSocket to a local web dashboard
- HTTP API if you want REST-style querying
Retention and Storage Considerations
Don’t keep every log forever unless you enjoy bloated SD cards. Keep daily logs for 7 days, weekly summaries for 3 months, and archive the rest off-device if needed. Use log rotation or InfluxDB’s retention policies.

- A single power supply, the operating voltage of between +3.0 to + 5.5V.
- INA219 is small size, not only to monitor the voltage drop across a shunt resistor on the sensing shunt supply voltage, …
- Zero drift 219 INA219 module up to 128 samples can be averaged to achieve filtering in noisy environments.
Building Your Logging System
Start with the Right Hardware
Before writing a single line of code, make sure your setup’s solid. Use a good USB meter or a sensor module like the INA219. Don’t cheap out on the USB power supply or cables—bad gear gives you bad readings.
Basic Setup for Beginners
Here’s a simple way to log power:
- Connect an INA219 to your Pi via I2C.
- Install the Python library.
- Create a script to record data every 5 seconds.
- Output values to a CSV file with timestamps.
Sample log entry:
2025-11-05 12:34:55, 4.98, 0.71, 3.54Where values = [Timestamp, Voltage (V), Current (A), Power (W)]
Intermediate: Add Time-Series Database
InfluxDB is a great match for hobby projects. Store each reading as a data point:
- Measurement: “powerlog”
- Tags: device=”pi4″, sensor=”ina219″
- Fields: voltage=4.98, current=0.71, power=3.54
This sets you up for long-term analysis, thresholds, and dashboards.
Advanced: Automate and Visualize
Set up Node-RED to:
- Pull data from InfluxDB
- Trigger alerts when current exceeds your Pi’s safe threshold
- Display a live dashboard with current draw over the last hour
Grafana can do the same, just with more polish.
Cron, Webhooks, and Remote Access
- Use cron jobs to run logging scripts on boot or every minute.
- Set up webhooks to push alerts to Discord, Slack, or email.
- Access the logs remotely with Grafana or a simple Flask dashboard hosted on your Pi.
Testing Your Setup
Try:
- Plugging in a USB SSD and watching the current spike.
- Logging boot sequences to catch peak draws.
- Running stress tests like
stress --cpu 4to monitor power under load.
These confirm your logger is working and your Pi isn’t skimming power from wishful thinking.
Use Cases in Hobby Projects
Overclocking and Monitoring Spikes
Overclocking a Raspberry Pi can boost performance—but also pushes power draw up fast. Logging with an INA260 or USB meter lets you watch how high the current peaks during boot or under CPU stress. It’s a handy way to find out if your supply has enough headroom or if you’re flirting with undervoltage errors.
Undervoltage from USB HDDs
Portable hard drives can pull more than 500 mA at startup. When plugged into the Pi, they often trigger voltage dips that lead to data corruption or device disconnects. Power monitoring shows exactly when the voltage sags, giving you evidence to either power the drive externally or get a powered hub.
Idle vs Load Profiles for NAS Builds
If you’re running a Pi-based NAS, logging lets you compare:
- Idle draw: 0.5 A typical
- Active file transfer: up to 1.5 A
- Multi-client stress: even more if you use a USB-to-Ethernet adapter
That’s useful when picking a battery pack, UPS, or power supply.
USB Device Diagnostics
Sometimes you don’t know which device is the problem. By logging power draw before and after plugging something in, you can isolate peripherals that are drawing way more power than they should. It’s like “whodunnit” for USB ports.
Remote Deployments and Solar Builds
Power’s not always stable in remote setups. Solar-powered Raspberry Pis benefit from logging because you can see if your panel and battery are keeping up. Combine this with temperature and uptime data, and you’ve got a real monitoring solution—not just crossed fingers.
Benchmarking USB Gadgets
Testing how much power your new USB microphone or game controller draws? Plug it into a hub connected through a meter. Track the current spikes during use, idle, and unplug events. It’s not just useful—it’s nerdy fun.
Optimizing Raspberry Pi Power Use
Small Tweaks That Make a Big Difference
Raspberry Pis are efficient, but once you start adding peripherals, power draw adds up. Good news? You can shave off a few watts with some smart tweaks—and verify them using your power logger.
Tactics to Cut Power Use
- Disable HDMI: Run
sudo /usr/bin/tvservice -oto turn off the HDMI port. Saves up to 25 mA. - Turn Off LEDs: Add config.txt tweaks like
dtparam=act_led_trigger=noneanddtparam=act_led_activelow=on. - Undervolt the CPU: Reduces heat and draw, but can cause instability if you push it too far.
- Remove USB Peripherals: Especially older USB devices that pull power just by existing.
- Use Efficient Power Supplies: A decent 5.1V 3A brick will outperform a cheap 5V 2A charger every time.
- Shorten USB Cable Runs: Less resistance means more stable voltage at the Pi’s input.
Measure, Don’t Assume
Check your logs before and after changes. You’ll often see immediate effects:
- Voltage increases by 0.05V after replacing a junky cable
- Idle current drops 0.1A after turning off HDMI and LEDs
Plan for Load Peaks
Look at your graphs—what’s the highest current your Pi draws? Add 20% safety margin when choosing a PSU. If your max is 2.2 A during a file transfer, don’t risk a 2.5 A charger. Get a 3 A or higher rated supply.
Budgeting for Battery or Solar Builds
Every milliamp matters when you’re off the grid. Logging lets you:
- Calculate average draw in mA
- Estimate daily energy in Wh
- Compare it to your battery/panel specs
This lets you avoid the classic mistake: deploying a Pi in the wild and watching it die at sunset.
Troubleshooting Power Issues with Logs
Reading Between the Spikes
You don’t need to guess why your Raspberry Pi rebooted or why that SD card corrupted again. Logs turn vague problems into concrete data. Once you’ve got timestamps and readings, you can match behavior with electrical conditions.
Symptoms of Power Trouble
- Lightning bolt icon: Raspberry Pi’s undervoltage warning.
- Random reboots: Usually tied to current spikes the PSU can’t handle.
- USB devices disconnecting: Often from voltage dips under load.
- Slow performance: CPU throttling due to power instability.
How to Catch the Culprit
Use your logs to look for:
- Voltage below 4.75V: Anything lower means trouble.
- Sudden dips when USB devices plug in: Sign of poor power supply or cable.
- Current over 2.5 A on a Pi 4: Might be pushing the limits.
- Correlated reboots and current spikes: Tells you what time and what caused the problem.
Use Historical Data to Prevent Future Failures
Look at the last 7 days of logs:
- Do undervoltage events line up with heavy usage?
- Are voltage drops getting worse over time?
- Are there patterns tied to peripherals being used?
Answering those tells you if it’s time to replace a power supply, upgrade your cables, or move USB devices to a powered hub.
Bonus: Spot the Silent Killers
Sometimes the Pi keeps running but corrupts data silently. Logs with consistent low voltage—like 4.60V all day—might not reboot the system, but can trash your SD card slowly. You won’t know unless you’re watching.
Final Thoughts
Power monitoring turns your Raspberry Pi from a guessing game into a known quantity. Whether you’re using a basic USB meter or building a full logging dashboard, the insights pay off. You’ll prevent silent errors, catch cheap hardware misbehaving, and get a clear picture of what your projects really need to stay stable. And yeah, it’s kind of fun to graph power like a data scientist with a soldering iron.
FAQ
Q: Can I use a USB meter and a sensor module at the same time?
A: Sure. The USB meter gives you quick visual checks, and the sensor feeds data to your logs. They don’t interfere with each other.
Q: Will a cheap USB cable affect power readings?
A: Absolutely. Thin cables can drop voltage under load, making readings look worse—or causing real problems.
Q: How often should I log data?
A: Every 5 seconds works for most hobby projects. You can go faster for spotting short spikes, but it adds more data.
Q: What’s the best sensor for Raspberry Pi power monitoring?
A: The INA219 is a solid choice—accurate, easy to use, and cheap. The INA260 is even better if you want built-in calibration.
Q: Do I need to calibrate my sensor?
A: Yes, if you want reliable numbers. Compare with a multimeter and adjust in software if needed.
References
- Raspberry Pi Forums – Power Supply Section
- Adafruit INA219 Tutorial
- Plugable USB-C Power Meter
- Grafana Documentation
- INA260 Datasheet – Texas Instruments