
As an Amazon Associate I earn from qualifying purchases. Some links in this guide are affiliate links.
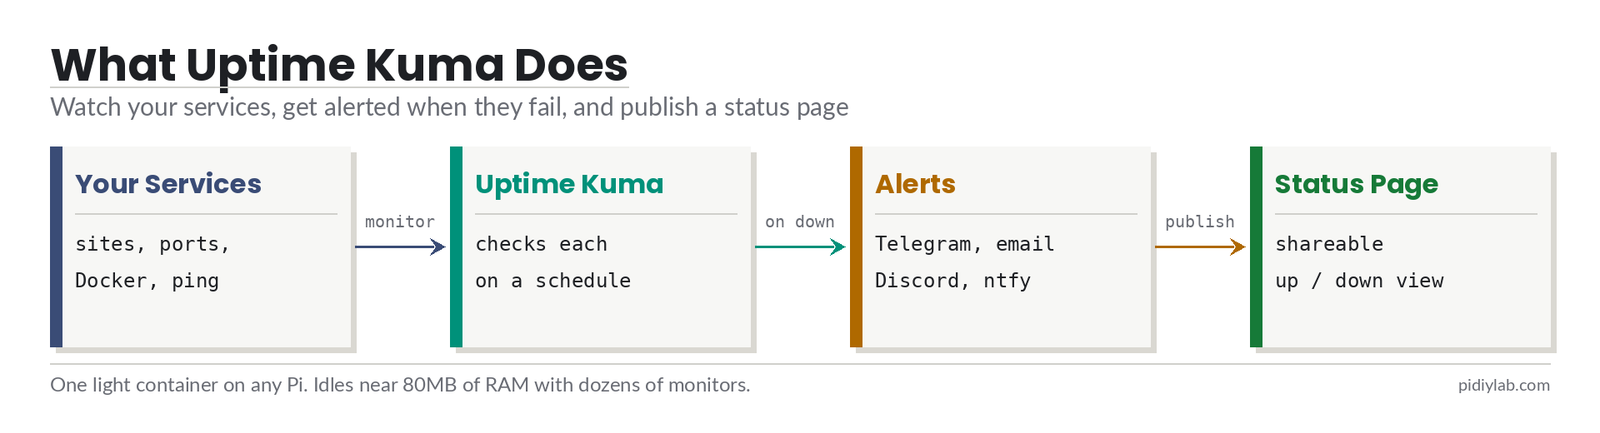
An Uptime Kuma Raspberry Pi setup gives you a free, self-hosted monitoring dashboard and status page that watches your sites, services, and home lab and alerts you the moment something goes down. It is a single lightweight container that idles around 80MB of RAM, so even a Pi 3 handles it, and it monitors HTTP, TCP ports, ping, DNS, and Docker containers, with notifications to Telegram, Discord, email, and dozens of other services.
This guide installs it with Docker, adds your first monitors, wires up alerts, and builds a public status page. It pairs naturally with the services in the media stack and anything else you run, and uses Docker as set up in the Docker on Raspberry Pi 5 guide.
Last tested: Raspberry Pi OS Trixie 64-bit | July 2026 | Raspberry Pi 5 (8GB) and Raspberry Pi 4 Model B | Docker Compose v2 | Uptime Kuma pinned to a major image tag
Key Takeaways
- Uptime Kuma is tiny. It is one Node process backed by a SQLite file, idling near 80MB of RAM and barely touching the CPU even with dozens of monitors, so any Pi from a 3 upward runs it comfortably.
- It does three jobs: it monitors (HTTP, TCP, ping, DNS, Docker, and more), it alerts (Telegram, Discord, email, ntfy, and many others), and it publishes a status page you can share. You get the core of a paid uptime service, self-hosted and free.
- Pin the image to a major version tag rather than tracking a moving one, and keep the admin dashboard off the public internet. A status page can be shared publicly through a reverse proxy while the dashboard stays private on your LAN or behind Tailscale.
What Uptime Kuma Is
Uptime Kuma is an open-source, self-hosted monitoring tool, the kind of thing you would otherwise pay a service like Uptime Robot for. You point it at the things you care about (a website, a home server, a Docker container, a game server) and it checks each one on a schedule, records the history, shows it on a clean dashboard, and notifies you when something fails or recovers. It also generates status pages, so you can publish a simple “is it up” page for family or users. Because you host it yourself, there are no monitor limits or subscription, and the data stays on your Pi.
What You Need
- Any Raspberry Pi that runs Docker (a Pi 3, 4, or 5); it is light enough for all of them
- Docker and the Compose plugin (see the Docker on Raspberry Pi 5 guide)
- A few hundred megabytes of RAM free, which any current Pi has
- The addresses of the sites and services you want to watch
Install Uptime Kuma with Docker
Create a project folder and a compose.yaml inside it. Pin the image to a major version tag rather than latest, so an unattended update cannot jump you across a major release. At the time of writing the long-stable line is 1 and a newer 2 line is available; check Docker Hub for the current major and use that:
services:
  uptime-kuma:
    image: louislam/uptime-kuma:1
    container_name: uptime-kuma
    volumes:
      - ./data:/app/data
    ports:
      - "3001:3001"
    restart: unless-stopped
Bring it up from that folder:
docker compose up -dOpen http://your-pi-ip:3001 in a browser. On the first visit you create the admin username and password, and you land on an empty dashboard ready for monitors. The data lives in the ./data folder next to the compose file, so your history and settings survive updates and restarts.
Add Your First Monitors
Click Add New Monitor and pick a type. The common ones:
- HTTP(s): checks a URL is reachable and returns a good status code. Best for websites and web apps.
- TCP Port: checks a host and port answer. Good for services without a web page, like SSH or a database.
- Ping: checks a host responds to ICMP. Good for confirming a device is on the network.
- DNS: checks a name resolves to the expected record.
- Docker Container: checks a container on the same host is running.
Set the check interval (60 seconds is a sensible default) and the number of retries before it counts as down, which avoids false alarms from a single blip. Save, and the monitor starts logging green or red immediately. Add one for each site and service you want to watch.
Set Up Notifications
A monitor is only useful if it tells you. Under Settings, Notifications, add a channel: Telegram, Discord, Slack, email (SMTP), ntfy, and many more are built in. Each one has a short setup, usually a token or webhook URL you paste in. Once a notification is added, attach it to your monitors (you can do this for all of them at once), and Uptime Kuma will message you when a service goes down and again when it recovers. Test it with the Test button before you rely on it.
Build a Public Status Page
Status pages are a separate feature from the dashboard. Go to Status Pages, create one with a name and slug, and drag the monitors you want to show onto it. You get a clean public page that reports each service as up or down, with uptime history, which is handy for a home server the family relies on or for services you host for others. To put it on your own domain, front it with a reverse proxy such as Caddy or Nginx Proxy Manager; the status page can be public while the admin dashboard stays private.
Keep It Running and Access It Safely
The restart: unless-stopped line brings Uptime Kuma back after a reboot. Treat the admin dashboard as private: do not port-forward 3001 to the internet. For access away from home, reach it over Tailscale or a reverse proxy that requires a login. The one thing it is reasonable to expose, through a reverse proxy, is a public status page, since that is designed to be shared and shows only up-or-down information. Back up the data folder occasionally and your whole configuration and history is safe.
Verify the Setup
docker compose psshows the container running.- The dashboard loads at
http://your-pi-ip:3001and you created the admin account. - A test monitor reports green, and turning off its target flips it red.
- A notification arrives when a monitor goes down and when it recovers.
- A status page displays your chosen monitors, and the
datafolder is being backed up.
Troubleshooting Your Uptime Kuma Raspberry Pi Setup
The container will not start. Check the log with docker compose logs uptime-kuma. A common cause is the data folder permissions or a port already in use; make sure nothing else uses 3001.
The dashboard is unreachable. Confirm the container is up with docker compose ps, that you are using the Pi’s LAN address with :3001, and that you are on the same network. A firewall on the Pi could also block the port.
A monitor shows down when the service is up. Increase the retries so a single missed check does not trigger an alert, and confirm the address and port are right from the Pi itself. For HTTPS monitors, a bad or expired certificate can also read as down.
Notifications never arrive. Use the Test button on the notification. Most failures are a wrong token or webhook URL, or the notification not being attached to the monitor.
Upgrading across major versions. Because you pinned a major tag, moving from the 1 line to the 2 line is a deliberate step, not an accident. Back up the data folder and read the project’s migration notes before changing the tag.
Hardware for This Build
- Uptime Kuma is light enough for a Raspberry Pi 4 (2GB) as a dedicated monitor, or a Raspberry Pi 5 (8GB) if it shares a board with other services.
- An Active Cooler and an official Pi 5 case suit a board that runs around the clock.
- Add a microSD card or small SSD and the official USB-C power supply.
FAQ
Is Uptime Kuma free?
Yes. Uptime Kuma is free and open source. You host it yourself, so there is no subscription and no cap on how many monitors you create; the only cost is the Pi it runs on and the electricity to keep it on.
What can Uptime Kuma monitor?
Websites and web apps over HTTP(s), any host and port over TCP, devices over ping, DNS records, Docker containers, game servers, and more. It also supports keyword checks and expected status codes, so you can confirm a page is not just reachable but actually serving the right content.
Can a Raspberry Pi run Uptime Kuma?
Easily. It idles around 80MB of RAM as a single Node process with a SQLite database, so a Pi 3, 4, or 5 all run it without strain, even with dozens of monitors. It is one of the lightest self-hosted tools you can run.
Uptime Kuma vs Uptime Robot: what is the difference?
Uptime Robot is a hosted service with a free tier that limits monitors and check frequency. Uptime Kuma is self-hosted, so you run it on your own Pi with unlimited monitors, faster intervals, and your data kept private, at the cost of maintaining it yourself. If you already run a Pi, Uptime Kuma gives you more for free.
Does Uptime Kuma have a status page?
Yes. It builds shareable status pages that show your chosen monitors as up or down with uptime history. Front it with a reverse proxy to serve the status page on your own domain while keeping the admin dashboard private.
References:
- Uptime Kuma project site: uptime.kuma.pet
- Uptime Kuma install and docs (GitHub wiki): github.com/louislam/uptime-kuma/wiki
- Docker Hub image (check the current major tag): hub.docker.com/r/louislam/uptime-kuma
About the Author
Chuck Wilson has been programming and building with computers since the Tandy 1000 era. His professional background includes CAD drafting, manufacturing line programming, and custom computer design. He runs PidiyLab in retirement, documenting Raspberry Pi and homelab projects that he actually deploys and maintains on real hardware. Every article on this site reflects hands-on testing on specific hardware and OS versions, not theoretical walkthroughs.
Tested on the hardware and OS noted at the top of this article. July 2026.